Consider the following statistics:
- 2 billion people i.e. 42% of the population worldwide use social media
- People spend 2 hours and 22 minutes on an average on social networks and messaging
- Facebook has 2.32 billion active monthly users
- 73% of the marketers believe social media marketing has been effective for their business
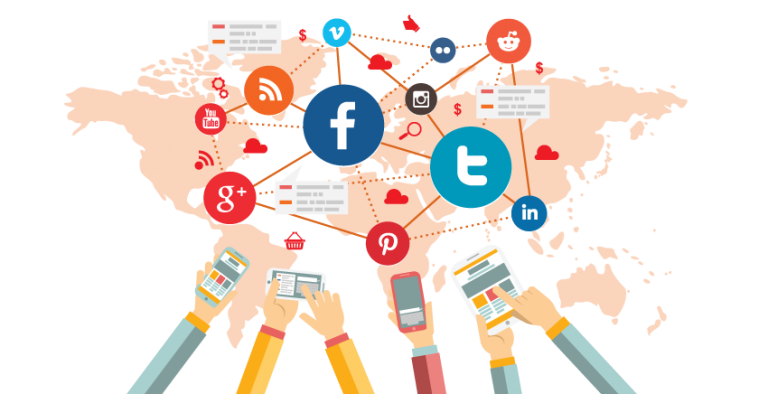
None of us can deny the power social media enjoys in today’s always-online world. Brands are trying to leverage the influence social enjoys, even customers are using social channels to reach the brand. Social platforms like Facebook, Instagram, Twitter and LinkedIn have opened avenues for marketers to get in touch with the right audience.
But how do you know your efforts are in the right direction? How do you find out you are connecting with the right audience? The obvious way of measuring it is data. You cannot be sure your efforts are paying off unless you measure your performance using appropriate social media KPIs.
Read: 47 Social Media Facts to Blow Your Mind
By analyzing the KPIs, you can track your success and tweak your social media strategy to suit your goals.
Let us discuss the top social media metrics that you need to track, what these metrics mean, how you can measure them and what they mean to your business.
So, let us dive in.
Top Social Media KPIs for Reach

Figure 1: Social Media KPIs to reach indicate the total number of users who may have seen your content.
Reach is the total number of users who may have seen your content. Reach can be measured through the following metrics:
1) Number of Followers: The most straightforward way of determining if you are reaching enough users is by counting the number of followers you have on social media platforms.
It is important to remember that followers who fail to engage with your posts will not benefit your brand much. Your follower count is, however, an important metric to begin your assessment.
2) Impressions: Impressions refers to the number of times your post showed up in someone’s timeline or newsfeed regardless of whether it was noticed or not. A single user can have multiple impressions.
For example, a user may see a post once on their own timeline and then again when someone in their network shares it. Though a vague metric, impressions indicate the number of people who could connect with your brand.
How to Measure Impressions:
Identify the number of impressions for a given post for a specific period, say a week, a month or a quarter. Compare this to the previous period to track the change.
3) Share of Voice (SOV): The more buzz your brand generates, the more likely it is to be mentioned in social media circles. Share of voice indicates how many people mentioned your brand vs your competitors. Share of voice gauges the relevance and popularity of your brand.
How to Measure Share of Voice:
Calculate a specific metric that represents your brand and divide it by the total market metric in your industry. Multiply this number by 100 to get your percentage market share for that metric.
For instance, if the hashtags for your brand appear 30 times and that for your entire industry appear 200 times in a week, then your share of voice for the period is:
30/200 * 100 = 15%
As of now, several analytical tools including Brandwatch and Awario measure your share of voice relative to similar brands.
Read: 6 Tricks to Boost Your Share of Voice on Social Media
Top Social Media KPIs for Engagement
KPIs for engagement indicate if people are interacting with your posts or not. These metrics measure the number of likes, shares and comments your posts generate. They are a better indicator of your brand popularity than ‘reach’ that merely measures the potential of your campaigns.

Figure 2: Social media KPIs for engagement indicate if people are interacting with your posts or not.
1) Likes: Brands like to associate themselves with popular ideas. The more likes your post has, the higher the engagement it is likely to generate. Posts with higher likes are understandably more popular among your audience and need thorough analysis from your marketing team.
2) Shares: While it is great to have likes on your social updates, shares take your user engagement to an altogether different level. Users sharing your posts indicate they are willing to recommend the brand to other users. Shares are hands down a stronger indicator of brand popularity than likes.
3) Comments: The end goal of each brand on social channels is to strike a conversation with their audience. If your content is informative, engaging and relevant, it has the potential to trigger a conversation among your followers.
Getting comments on your posts indicates your brand is creating an impact. Do not worry if the response is negative: at least you will get to know what kind of posts you need to keep away from.
Top Social Media KPIs for Conversion
Conversions are the best way to gauge the success of your social media campaigns. In words of John Munsell, CEO of Bizzuka:
“If the content is king, then conversion is queen.”
When your posts start generating responses in the form of likes, comments and shares, the obvious next step would be to analyze how your social media posts are impacting your revenue. If you have a huge following on social media and none of your followers buys your product/service, what’s the point in putting in so much effort?
Let us go through some key social media metrics for conversion:
1) Click-Through Rate (CTR): Click-through rate indicates how often users click on the links in your social media posts.
A high CTR implies a high percentage of people who saw your post clicked on its link and reached your website. This means your message created the right impact and triggered the audience to take action.
Applicable to both organic and paid posts, CTR is a common metric for anyone accountable for social media marketing, email marketing, SEO and AdWords.
Now you might be wondering how much CTR is considered good enough. There is no single answer as the ideal value of CTR varies from industry to industry. However, a CTR in the range of 1-1.5% is considered decent.
How to Measure Click-Through Rate
(Total Clicks)/ (Total Impressions) * 100
So, if your sponsored post on Facebook generates 200 clicks and 20000 impressions, the click-through rate is
200/20000* 100 = 1%
2) Conversion Rate: While it is crucial to have a high CTR for your posts, your efforts will go down the drain if the users who click on your social link reach the landing page of your website but do not complete the desired action e.g. subscribing your newsletter, downloading a guide or scheduling a call.
Conversion rate measures what percentage of users who click on your link convert i.e. take the desired action.
How to measure Conversion Rate
(Total Conversions)/ (Total Clicks) * 100
If, say, 2000 people click on your Instagram post and only 50 download the social media guide available on your website, your conversion rate is 50/2000*100 = 2.5%
3) Bounce Rate: Bounce rate is the number of people who land on your website after clicking your social link but instead of browsing further abandon your website. This metric gauges the impression your website is creating among your target audience.
If your bounce rate is high, something is wrong with either your website or your social link.
How to measure Bounce Rate
(Users abandoning your website after landing page)/ (Total Users visiting your website)* 100
Read: Understanding bounce rate in Google Analytics
4) Cost per Click (CPC): Cost per Click is your total expense per click on your sponsored social media post for a specified period.
How to measure Cost per Click
Ad Spend/Total number of Clicks
For example, you spent 50, 000 INR for a sponsored post on Facebook that received 500 clicks. The cost per click, in this case, would be 50,000/500 i.e. 100 INR per click.
When it comes to gauging the effectiveness of a social media ad, this metric is far more effective than ad spend. CPC indicates whether your ad spend is efficient or wasteful.
5) Cost per Thousand Impressions (CPM)
CPM is the amount you pay after your sponsored post on social media has received 1000 impressions. CPM is somewhat similar to CPC but not as effective. CPM is useful when your primary goal of running a sponsored post is to expose a new audience to your brand i.e. when you are trying to enhance the visibility of your brand.
How to measure Cost per Thousand Impressions
Ad Spend/Impressions*1000
Top Social Media KPIs for Customer Loyalty

Figure 3: Social media, if used appropriately, can become a tool for augmenting brand loyalty.
Social media, if used appropriately, can become a major tool for augmenting brand loyalty. If you measure the metrics correctly, you can optimize your ad spend, bolster brand advocacy and convert users doing one-time purchases into loyal customers.
Let us discuss the key metrics for measuring customer loyalty.
1) Customer Satisfaction (CSAT) Score: Customer satisfaction has always been a reliable indicator of the growth of a business.
In this digital age, customer satisfaction has become more important than ever: Unhappy customers can vent their frustration on social channels causing irreversible damage to your brand. On the flip side, delighted customers can recommend your brand to others, resulting in improved loyalty for your enterprise.
CSAT measures how satisfied users are with your product or service.
CSAT is usually assessed through a customer feedback survey wherein the customer is asked to rate the product/service on a scale of 1 to 10, 1 being the lowest and 10 being the highest. The results are then averaged to arrive at a composite score.
2) Net Promoter Score (NPS): Net Promoter Score or NPS is an indicator of customer loyalty. Developed by Bain and Company in 2003, NPS is widely used by brands to track how they are perceived by their customers.
Read: What is Net Promoter Score (NPS)? Definition & Examples
Customers are asked how likely it is that they would recommend the brand’s product or service to a friend or colleague.
The respondents have to provide a rating between 0 (not at all recommend) and 10 (definitely recommend) and depending on their rating, the customers are categorized into promoters (9 or 10), passives (7 or 8) or detractors (0 to 6).
Once all the customers have provided their ratings, NPS is calculated by subtracting the percentage of detractors from the percentage of promoters.
In other words,
NPS = %Promoters -%Detractors
Wrapping it up
Social media KPIs offer valuable insights on your marketing efforts. By assessing your reach, impressions, engagement, conversions and customer loyalty, these metrics help you devise a blueprint for your future social media efforts.
Any other significant social media KPIs we forgot to mention? Let us know in the comments below.